Last week I stumbled across a javascript library so cool I had to share it.
It’s called Raphael JS, and you can use it to simplify your work with SVGs in the browser. As I’ve been learning D3.js, I’ve been generating svgs to represent data values and create charts, but these are the most rudimentary svgs and I have a lot more to discover about vector art.
I discovered Raphael whilst pondering how to represent data at a regional level without having to engage a powerful mapping API like Mapbox or Carto. These are both amazing resources and I’ll use them if heavy lifting is called for, but on this occasion all I needed was a simple vector outline to hover over with the mouse.
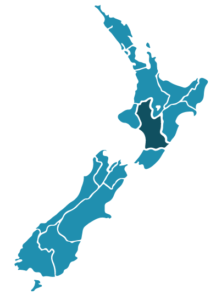
I pasted a map of New Zealand into Adobe Illustrator, ran an image trace, and separated the country into its respective regions.
I had intended to save each region as an individual svg, then attempt to manually position them in the browser. Luckily, I came across Raphael before I wasted any more time.
Raphael allows you to create your svgs as DOM objects so that you can bind javascript handlers to them, and make them respond to user behaviour such as clicks and mouse hovers. The possibilities are far more extensive than the simple little map I made, but as with all learning projects I’m taking this one step at a time.
What’s really exciting is the potential to combine Raphael and D3 to produce more elegant data visualisations in future, and use D3 to bind data to Raphael objects. I’m looking forward to finding out how I can make these libraries complement each other in future projects.
For now though, take a look at this svg to Raphael JS converter.
This is what I used to make my simple interactive regional map. Illustrator lets you export your vector file to SVG by selecting file > export > svg. If you have multiple artboards in your file, you can select Use Artboards to create separate individual svg files.
Once I’d exported my svg file, I opened it in a text editor, and noticed that Illustrator had even separated my layers into separate classes; not immediately useful in this project, but something to bear in mind for next time. I coped the svg text, and pasted it into the converter.
The code the converter spat out needed some cleaning up, better variable names and indenting, but this didn’t take long.
With the svg paths assigned to variables named for the regions they represented, it was a simple matter to iterate through an array of the regions and use some simple javascript to highlight each region on mouseover.
I’m looking forward to attaching some interesting regional data to this simple vector map, to create an engaging interactive, so watch this space.
Data is beautiful – Sarah

